

Interactive visual analytics for immediate data discovery
About Tableau
Tableau helps people see and understand data. Seven words that drive everything Tableau does. And they’ve never been more important. In 2020 the world will generate 50 times the amount of data as in 2011. And 75 times the number of information sources (IDC, 2011). Within these data are huge, unparalleled opportunities for human advancement. But to turn opportunities into reality, people need the power of data at their fingertips. Tableau is building software to deliver exactly that. Tableau products are transforming the way people use data to solve problems. It makes analyzing data fast and easy, beautiful and useful. It’s software for anyone and everyone. To learn more about Tableau, visit www.tableau.com.
How Does Competitive Analytics Add Value?
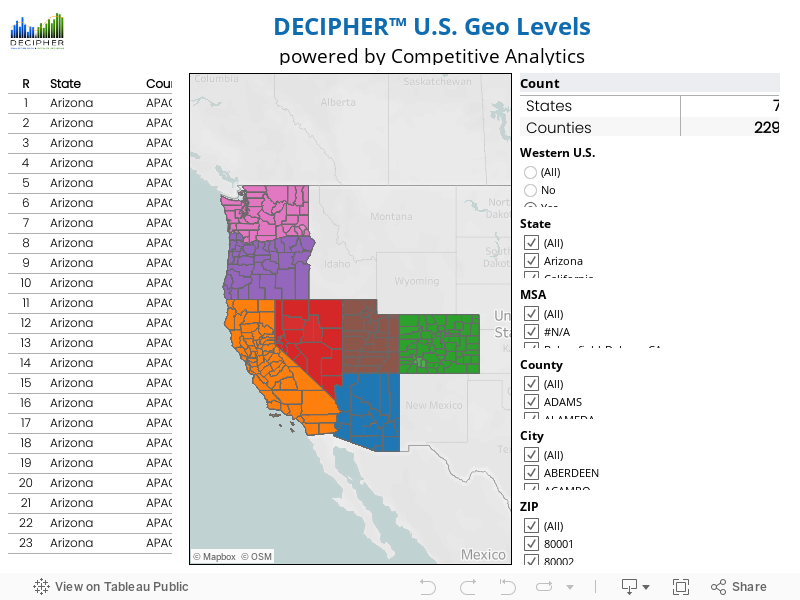
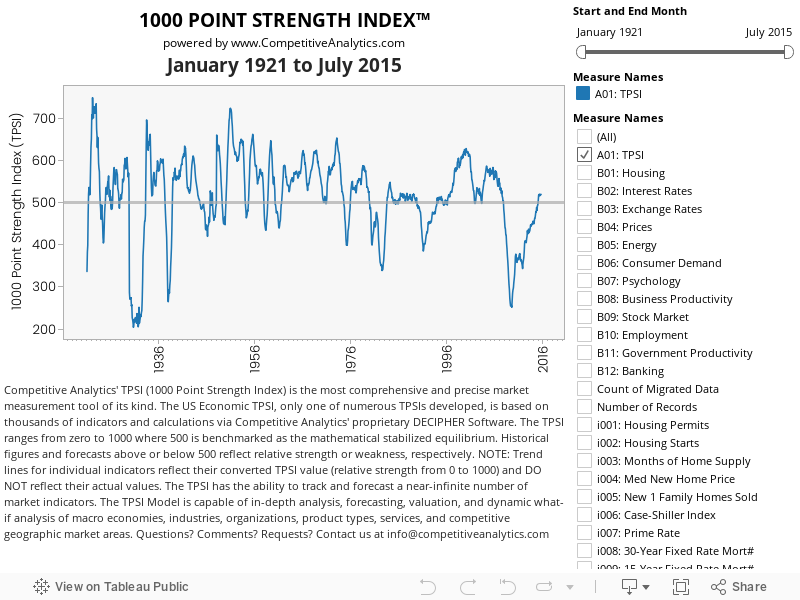
Competitive Analytics helps organizations visualize and understand their data by teaching analysts how to effectively build powerful dashboards, or simply building them for you to gain immediate insight. We offer user group meetings, training and private visualization workshops, and a variety of custom approaches depending on the needs and timing of your organization. The following interactive Tableau dashboards illustrate Competitive Analytics’ proprietary 1000 Point Strength Index (“TPSI”). The TPSI integrates myriad economic indicators and empowers executives with the most accurate understanding of the strength, direction, and momentum of the U.S. economy. The TPSI ranges from zero to 1000 where 500 is benchmarked as the mathematical stabilized equilibrium. Historical figures and forecasts above or below 500 reflect relative strength or weakness, respectively. For more information about how Competitive Analytics can help you achieve maximized results with Tableau, contact us.
Learn more about Tableau Software
Tableau software is easy to learn, easy to use, and faster than existing solutions. It allows you to feed your data directly into interactive dashboards, for unparalleled data visualizations designed to help executives make better, faster decisions. Tableau allows you to make data discoveries in seconds. You can highlight and filter data to show relationships, string together specific insights to help you form a story with your data, and easily form conclusions by combining multiple views into a single interactive dashboard. Learn more about Tableau by visiting http://www.tableau.com/.
Tableau Desktop Product Tour
Tableau Desktop is based on breakthrough technology from Stanford University that lets you drag & drop to analyze data. You can connect to data in a few clicks, then visualize and create interactive dashboards with a few more.
Tableau Dashboards
Interactive data visualizations
What is the TPSI?
Competitive Analytics’ proprietary 1000 Point Strength Index (“TPSI”) integrates myriad economic indicators and empowers executives with the most accurate understanding of the strength, direction, and momentum of the U.S. economy. The TPSI ranges from zero to 1000 where 500 is benchmarked as the mathematical stabilized equilibrium. Historical figures and forecasts above or below 500 reflect relative strength or weakness, respectively.
The following are examples of the TPSI for the US economy.
Who Uses Tableau? Here’s just a a few examples:
• Allstate Insurance, Insurance
• Amica, Insurance
• AOL, Media, Entertainment & Publishing
• AREVA, Energy & Utilities
• Aspire Public Schools, Education
• Blastrac Manufacturing, Manufacturing
• Camelot Strategic Marketing & Media, Media, Entert. & Publishing
• Cheyne Capital, Investment Services
• China Eastern Airlines, Transportation & Logistics
• City of Charlotte, Government
• Cornell University, Education
• Creighton University, Education
• Dallas Cowboys, Retail & Distribution
• DePaul University, Education
• DePauw University, Education
• eBay, Retail & Distribution
• EMC, Software & Technology
• Equinox Ltd, Software & Technology
• Ernst & Young, Business Services
• eteamz, Media, Entertainment & Publishing
• Ferrari, Retail & Distribution
• FiberTower, Software & Technology
• First American Corporation, Business Services
• First Choice Power, Energy & Utilities
• Flyer Enterprises, Retail & Distribution
• Intel, Software & Technology
• Jacksonville State University, Education
• Kabel Deutschland, Telecommunications
• Kaleida Health, Healthcare & Medical
• Kwantum, Retail & Distribution
• Kwantum, Transportation & Logistics
• Locatus, Media, Entertainment & Publishing
• LSU Health Sciences, Healthcare & Medical
• MAPLight.org, Government
• Maritime & Mercantile, Other
• Mercer, Business Services
• Millard Public Schools, Education
• Mindshare, Media, Entertainment & Publishing
• National Financial Partners, Investment Services
• National Motor Club, Transportation & Logistics
• Nokia, Telecommunications
• Oco, Software & Technology
• Omega, Software & Technology
• OptumHealth, Insurance
• Oxford University, Education
• Pacific Northwest National Labs, Government
• Pacific University, Education
• Pearson, Education
• Playdom, Software & Technology
• Predicta Brazil, Media, Entertainment & Publishing
• RBC Wealth Management, Banking & Finance
• Region 4, Education
• Rosenblatt Securities, Investment Services
• Rosenblatt Securities, Investment Services
• Ryan Nokes, Media, Entertainment & Publishing
• Schuberg Philis, Software & Technology
• Seattle Children’s, Healthcare & Medical
• Seattle Times, Media, Entertainment & Publishing
• Service Corporation International, Business Services
• Silvaris, Consumer Goods & Services
• Stanford University, Education
• Sveriges Television, Media, Entertainment & Publishing
• Swedbank, Banking & Finance
• The Danish Olympic Committee, Other
• The Martin Agency, Media, Entertainment & Publishing
• ThoughtStorm, Investment Services
• Trexin, Investment Services
• UnitedHealthcare, Insurance
• University of California, Irvine – Medical Center, Healthcare & Medical
• US Auto Parts, Retail & Distribution
• Wells Fargo Bank, Banking & Finance
• Yale University, Education