
COVID-19 Analytics
First and foremost, please be safe!
Day 170 [Thursday, July 9, 2020 @ 3:34:22 PM PDT]. Due to the seismic societal shifts and economic paradigm transformations that will negatively impact all industries, businesses, and citizens . . . we developed the following COVID-19 Analytics Resource Page for our clients, colleagues, and friends. We will be updating these chats and adding unique content and perspectives several times a week. Please scroll down for more details about our US Economic Performance via our proprietary 1000 Point Strength Index (TPSI), COVID-19 Confirmed Cases Scenarios, Real GDP Cycles, Key Observations and Trends, Recession Planning Services, and Competitive Analytics’ bespoke services.
Please contact us at 714-545-2555 or info@competitiveanalytics.com if you have any questions, comments, or requests.
COVID-19 Cases VERSUS Deaths
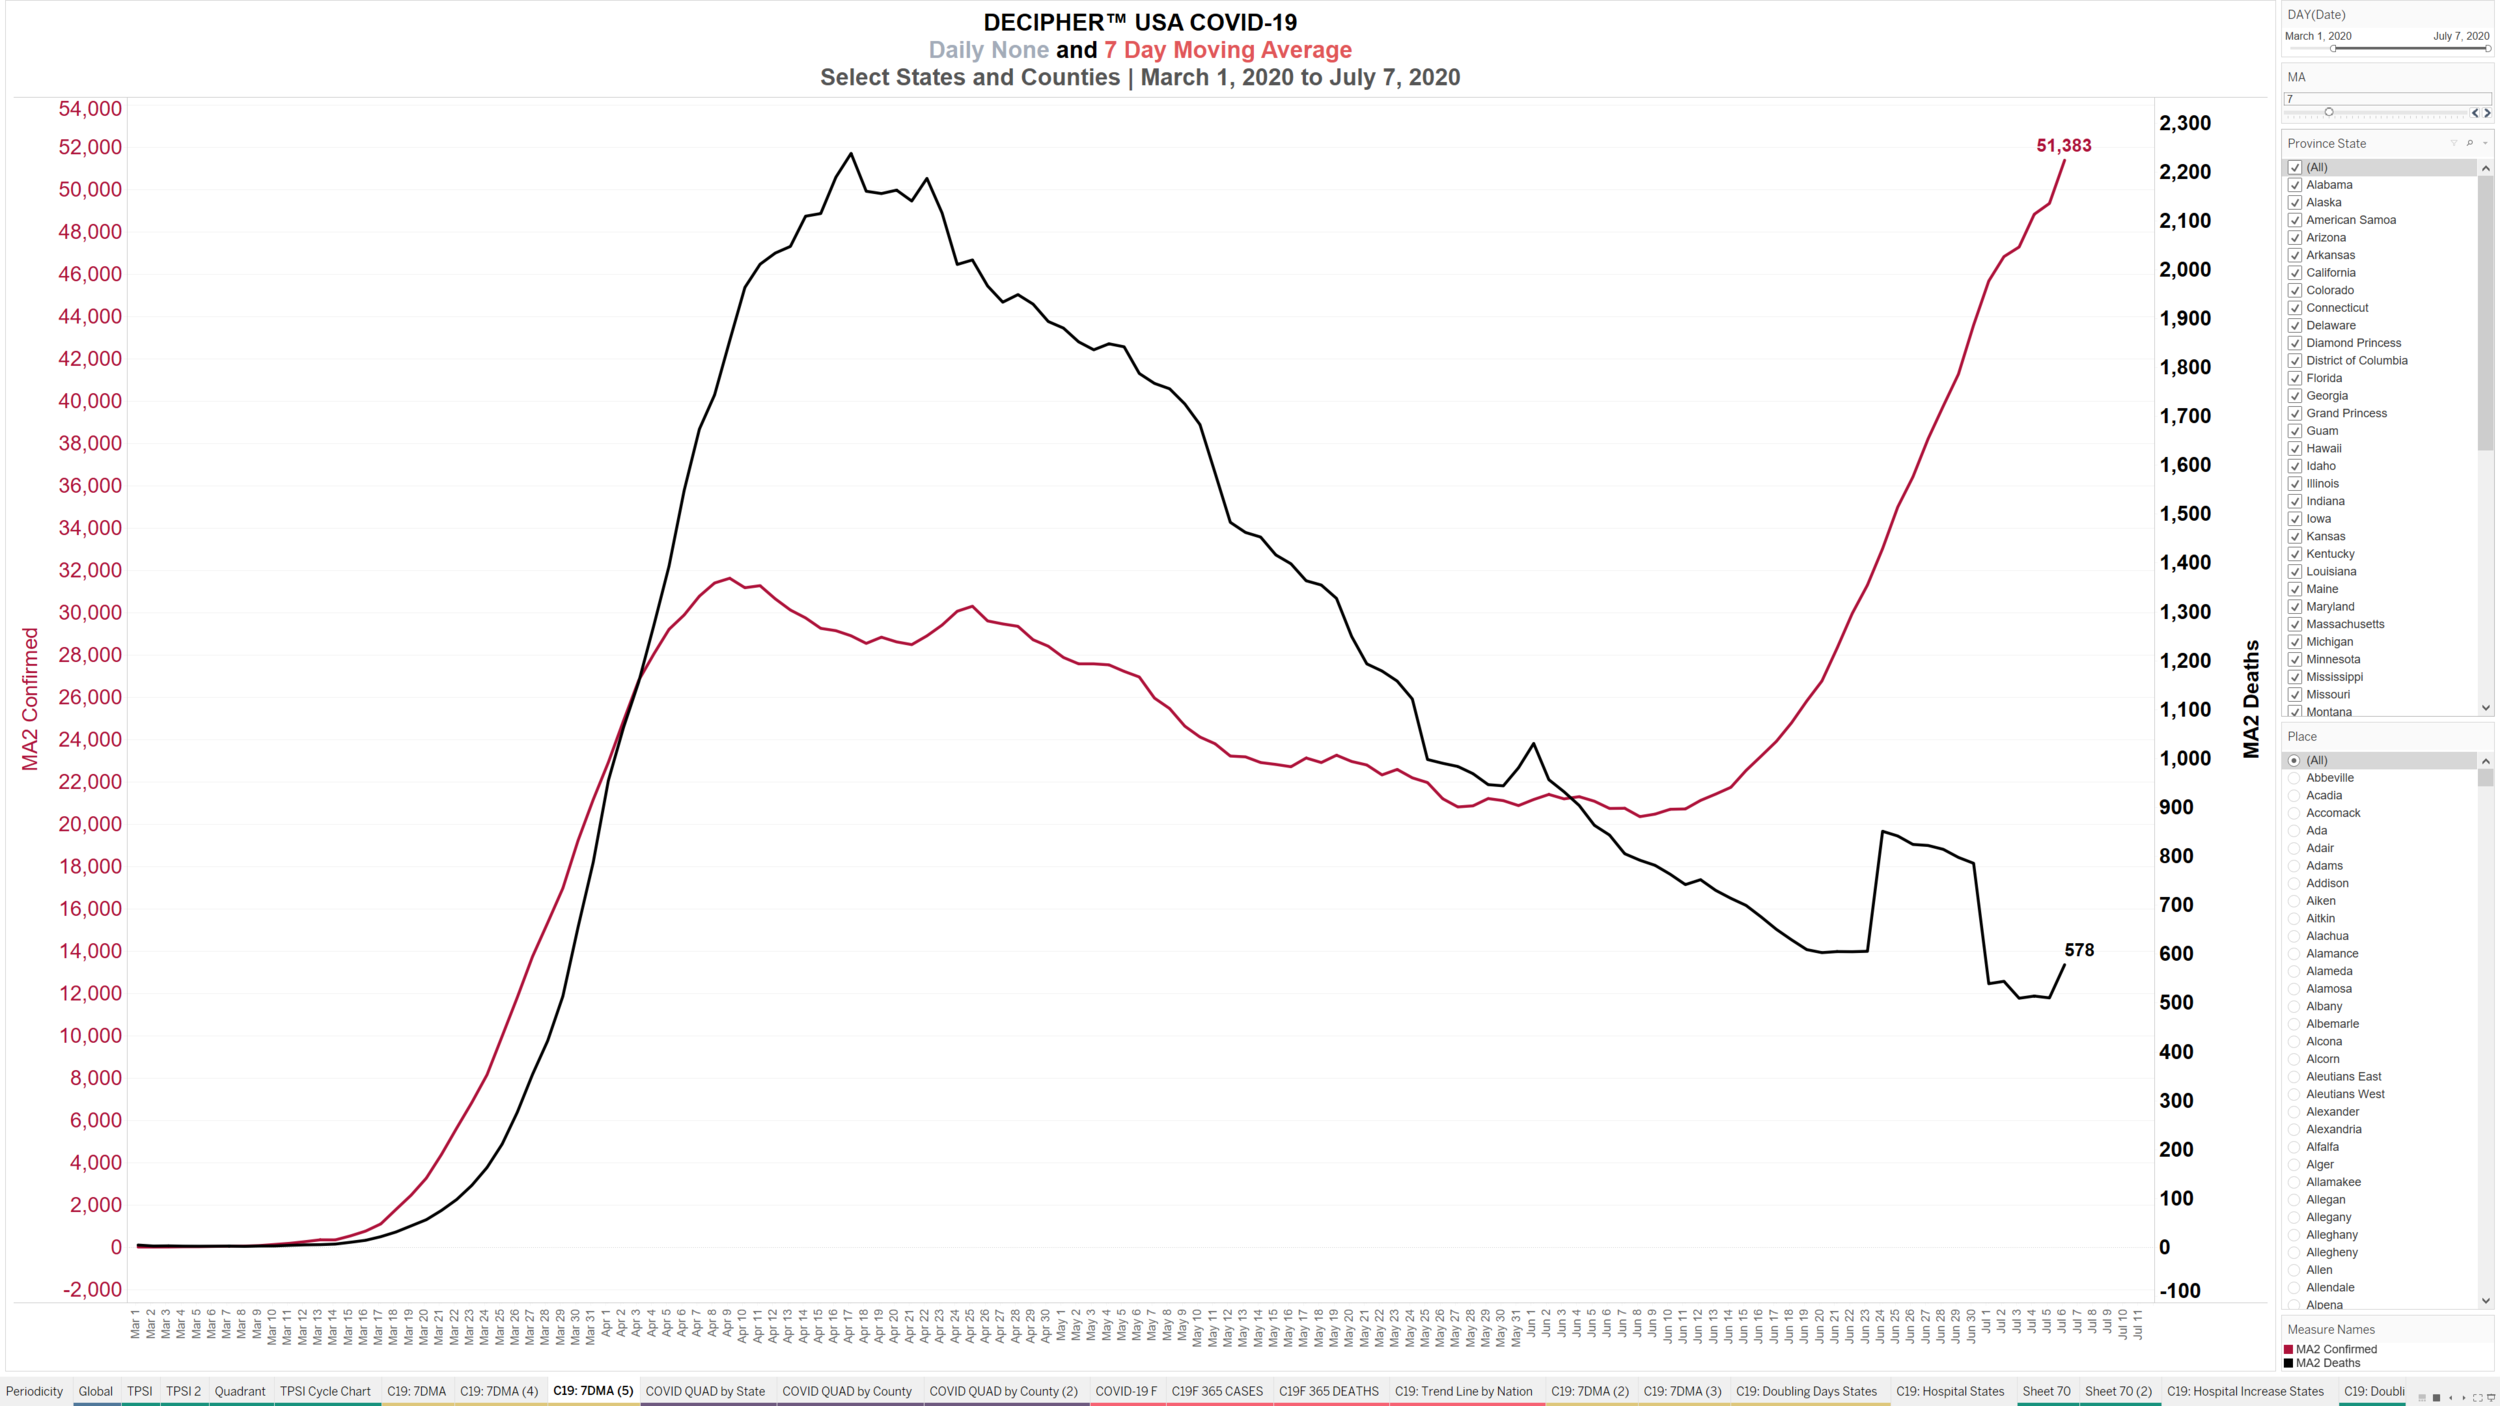
COVID-19 Deaths as % of Confirmed Cases Downshifting in California?
The following chart illustrates “Deaths as % of Confirmed Cases” for nine counties within the state of California with total population > 1,000,000. Does this downshifting trend since ~ mid May 2020 provide evidence of COVID-19’s severity starting to diminish?

COVID-19 Doubling Rate

COVID-19 Economic Impact Scenarios (United States of America)
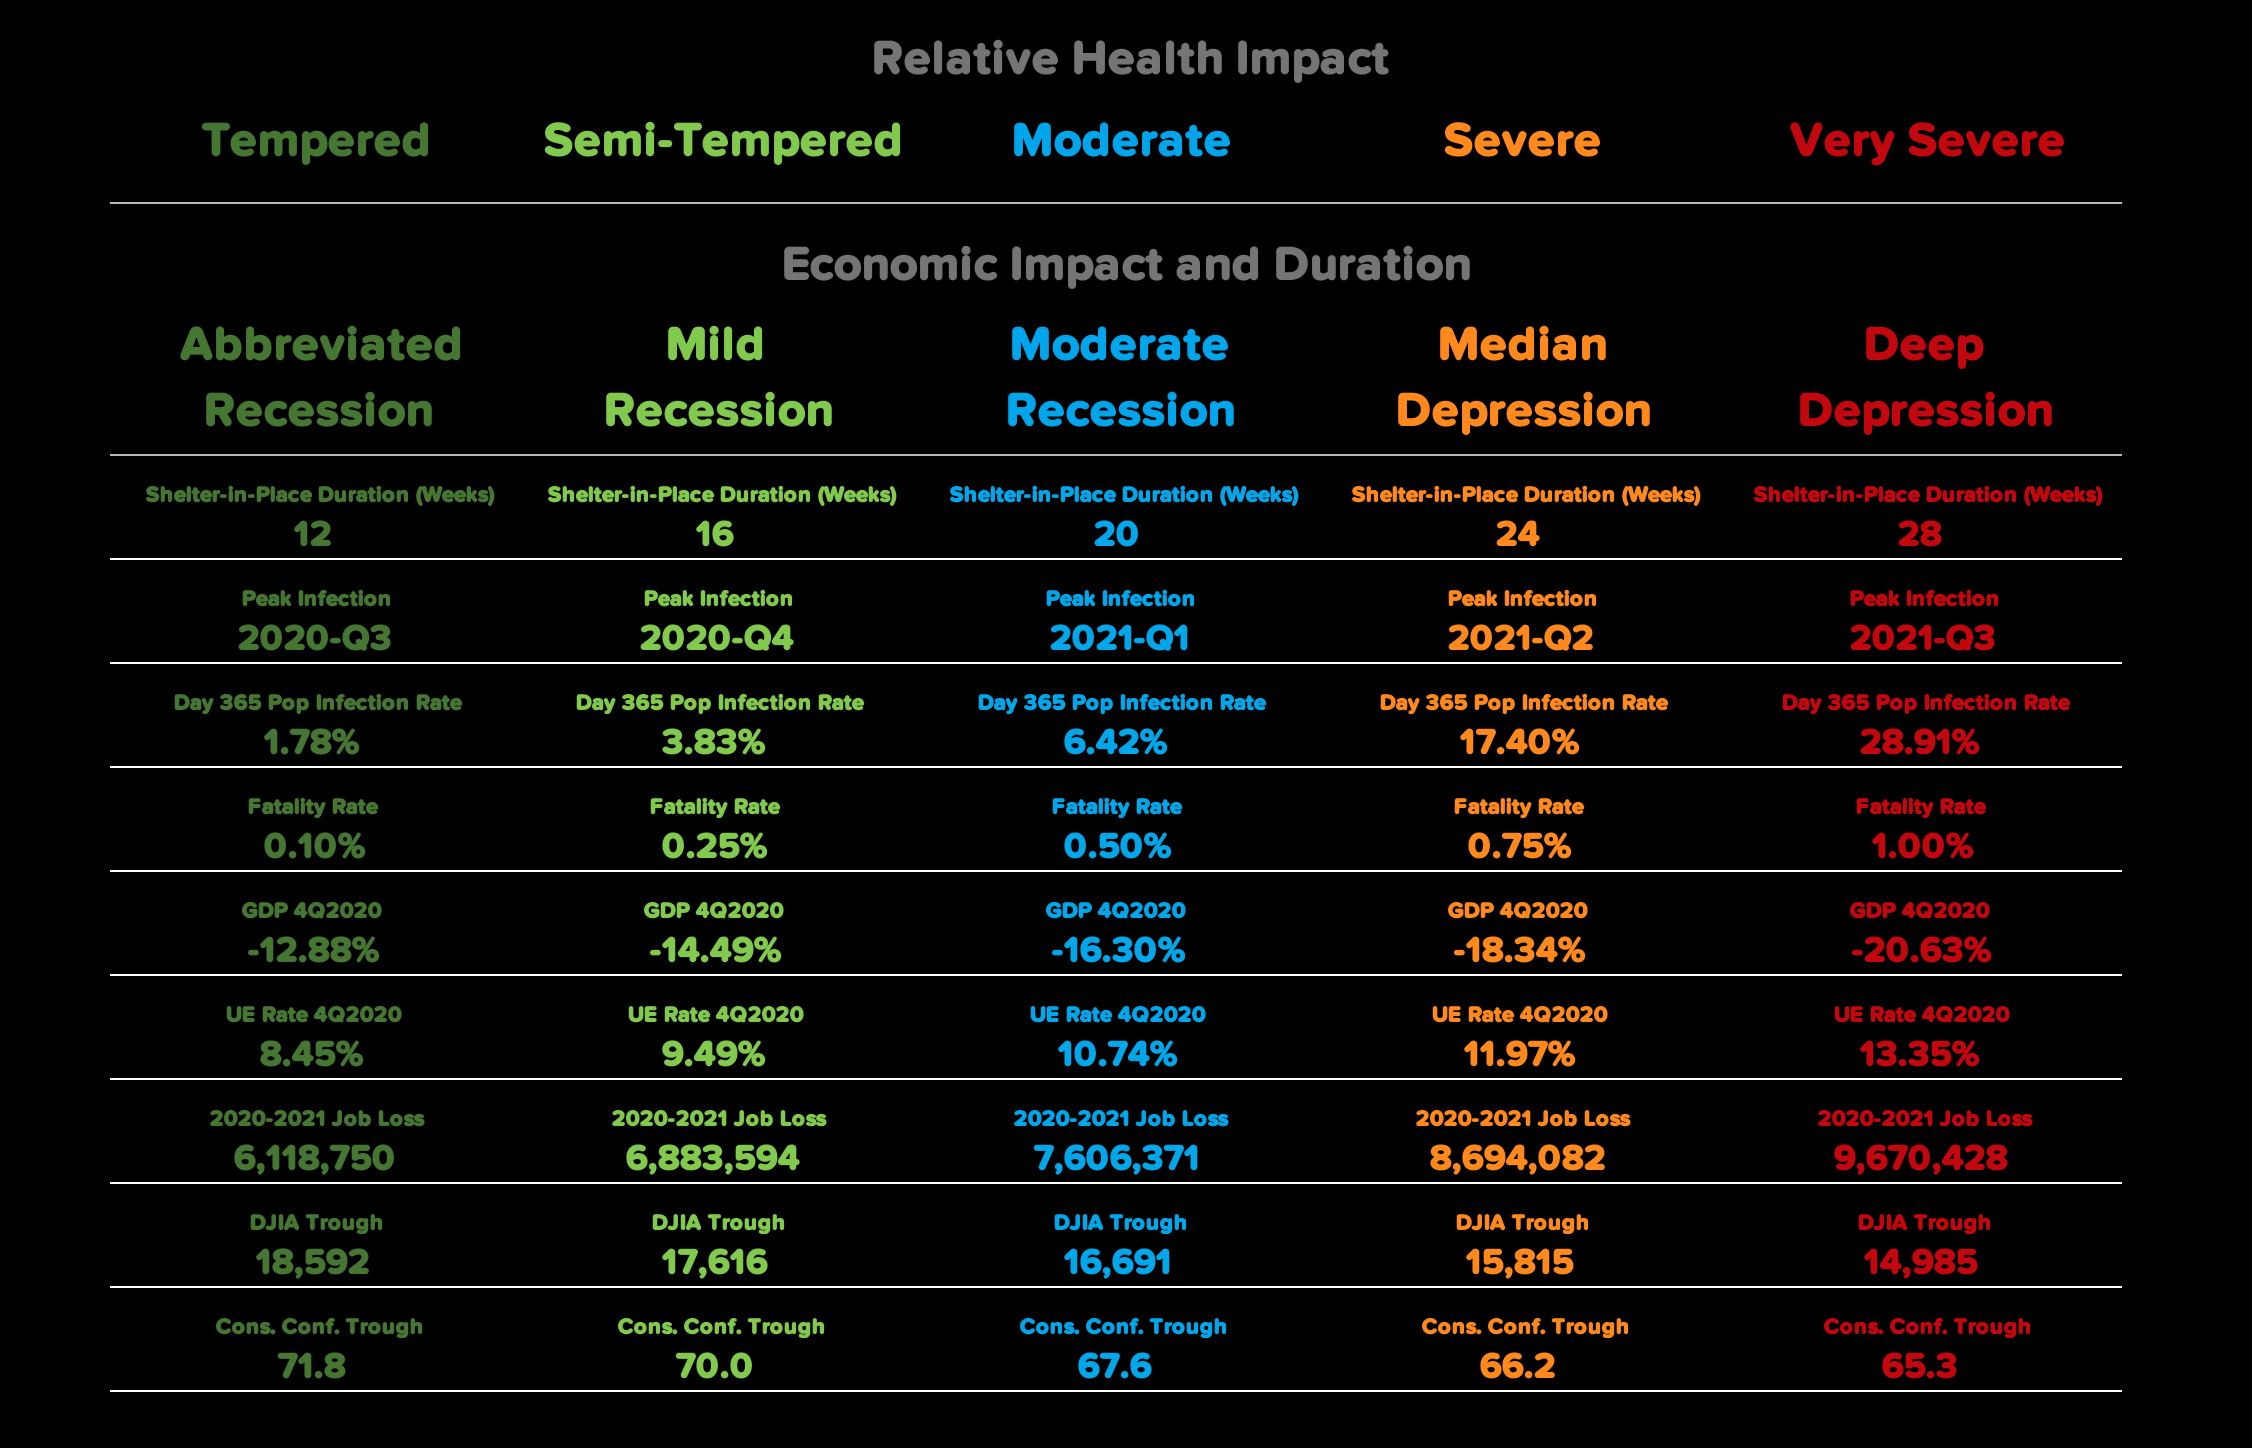
STANDARD CYCLE SCENARIOS. The first chart below illustrates Competitive Analytics’ what-if machine learning models for five COVID-19 impact scenarios . . . and how COVID-19 will impact the US macroeconomy, and thus, how COVID-19 will impact all industries, companies, and consumers. Scenarios (i.e. range of outcomes) are based on: 1) Series of Relative Health Impact Outcomes (see below); 2) Economic Impact and Duration Scenarios (see below); 3) Historical time series data encapsulating over 500,000 indicators via our TPSI model; 4) historical economic cycles and business cycles; 5) Series of correlative and weighted predictive analytics algorithms; 6) Partial behavioral adherence to physical-social distancing; 7) Moderate positive impact of federal crisis management/governance; 8) Moderate positive impact of state and local crisis management/governance 9) Moderate deceleration of cases and deaths; and 10) Moderate pace of COVID-19 abatement and/or cure.
ACCELERATED CYCLE SCENARIOS. The second chart follows the methodology of the STANDARD CYCLE SCENARIOS yet assumes: A) 100% behavioral adherence to physical-social distancing; B) Significant positive impact of federal crisis management/governance; C) Significant positive impact of state and local crisis management/governance; D) significant deceleration of cases and deaths; and E) Accelerated pace of COVID-19 abatement and/or cure.
1000 Point Strength Index: US Economic Performance
Day 170 [Thursday, July 9, 2020 @ 2:10:57 PM PDT]. Competitive Analytics’ 1000 Point Strength Index (“TPSI”) for the US economy as of June 07, 2020 = 316.44 which is materially below the 500.00 equilibrium benchmark AND 240.50 points BELOW the economic cycle peak of 556.94 during May 2018. The TPSI encapsulates daily, weekly, monthly, quarterly, and annual data from Jan 1798 to June 2020. Scroll below “About TPSI (1000 Point Strength Index).”
The US TPSI realized two successive historical one month slides during March and April 2020:
83.78 point drop from February 2020's TPSI of 420.15 to March 2020’s TPSI of 336.37. This 83.78 point drop equates to the 0.9985 percentile of all time monthly decreases. Another way to look at it: the Median Monthly TPSI Drop for 222 years of data = 3.88 points, thus, March 2020’s drop of 83.78 points is 21.59 greater than the typical TPSI drop.
15.65 point drop from March 2020's TPSI of 336.37 to April 2020’s TPSI of 320.72.
7.25 point increase from April 2020's TPSI of 320.72 to May 2020’s TPSI of 327.97.
11.53 point drop from May 2020's TPSI of 327.97 to June 2020’s TPSI of 316.44.
It should be emphasized that the US TPSI was already trending lower since the cycle peak of 556.94 during May 2018 (despite many economists and media outlets claiming the economy was continuing to grow and accelerate during this time by myopically focusing on a handful of economic indicators such as GDP and DJIA), market forces were already pressuring the US TPSI downward since May 2018 . . . and current fears of potential exponential spread of COVID-19 is expected to exacerbate and quicken the already decreasing US TPSI.
The following five COVID-19 Impact Scenarios illustrate the tectonic shift in economic conditions that has already started. Stay tuned for updates . . . Competitive Analytics is planning to update these forecast scenarios several times per week. As always, please do not hesitate to contact me if you have any questions, comments.
Forecasts: Competitive Analytics’ Ensemble Modeling
About TPSI (1000 Point Strength Index)
Competitive Analytics’ proprietary 1000 Point Strength Index (“TPSI”) integrates over 500,000 macro-micro economic indicators and empowers executives with the most accurate understanding of the strength, direction, and momentum of the U.S. economy as well as all sectors and industries. The TPSI ranges from zero to 1000 where 500 is benchmarked as the mathematical stabilized equilibrium. Historical figures and forecasts above or below 500 reflect relative strength or weakness, respectively. Competitive Analytics’ TPSI has been used for analyzing multiple sectors, industries, companies, products, assets, and strategies. Another valuable attribute of the TPSI is the ability to compare relative strengths and weaknesses across all components and dimensions of an organization, competitive landscape, economy, and/or market. Our TPSI is one of the core tools we designed and developed - that not only is used to measure macroeconomic performance, industry performance, geospatial scoring and ranking, competitive performance, etc. - Competitive Analytics also designed the TPSI to be used for diagnostic, predictive, and prescriptive modeling projects and initiatives for our clients’ need for price optimization, product segmentation, expense minimization, logistics, demand forecasting, HR/people analytics, etc. The TPSI also is designed to be applied across all industries for a diverse cross-section of clients (users of our TPSI include Toyota, Honda, Cetera Financial, Boeing, Macy’s, Yamaha, Eaton, City of Anaheim, and many others). Moreover, the TPSI integrates myriad external times series data (macroeconomic, microeconomic, demographic, psychometric, etc.) with internal client KPIs, accounting data, budget data, pro forma financials, sales data, etc. Thus, a company can visualize their performance with all potential correlative drivers and leading indicators in a holistic and insightful way. And our TPSI is updated via machine learning every day.
January 22, 2021 Confirmed Cases Forecast: Flattening Models + Exponential Boost Models
The following chart illustrates actual confirmed cases within the United States of America AND seven forecast scenarios based on applying current trends coupled with exponential boost scenarios based on a reemergence of cases due to the opening-up of businesses and loosening of social distancing practices. Forecasts range from 5,860,318 (low probability) to 57,409,762 (median scenario) to 198,870,297 (max scenario). Note the Y-Axis is logarithmic.

Historical Data: The Center for Systems Science and Engineering (CSSE) at Johns Hopkins University (JHU)
Forecasts: Competitive Analytics’ Ensemble Modeling
January 22, 2021 Deaths Forecast: Flattening Models + Exponential Boost Models
The following chart illustrates actual deaths within the United States of America AND seven forecast scenarios based on applying current trends coupled with exponential boost scenarios based on a reemergence of cases due to the opening-up of businesses and loosening of social distancing practices. Forecasts range from 229,439 (low probability) to 1,945,514 (median scenario) to 5,578,959 (max scenario). Note the Y-Axis is logarithmic.

Historical Data: The Center for Systems Science and Engineering (CSSE) at Johns Hopkins University (JHU)
Forecasts: Competitive Analytics’ Ensemble Modeling
30 CYCLE TROUGH TO TROUGH HISTORY

About Real GDP Forecasts
As a bevy of GDP forecasts have been and will be released . . . numerous hyper-aggressive recovery forecasts are published with little resemblence to the data of prior cycles. Thus, we feel strongly that readers of forecasts understand the cycle history of Real Gross Domestic Product (“RGDP”) - the inflation adjusted value of the goods and services produced by labor and property located in the United States:
Essentially, there are 12 cycles of RGDP from 1947Q2 to 20194Q based on a compounded annual rate of change (source: https://fred.stlouisfed.org/series/GDPC1#0)
We define RGDP “Cycle Start" as the quarter of initial negative RGDP.
We define RGDP “Cycle End" when RGDP >= 2.50% for two successive quarters are achieved.
When you calculate a distribution of historical cycles by percentile, the 40P, Median, and 60P = 12 months (4 quarters). So, economists and analysts predicting a lightning fast recovery later this year (i.e. 1 or 3 quarters or 3 to 9 months) seems overly aggressive (i.e. insane?) . . . considering this crisis is NOT going to be an “average or median downshift”. Is it possible? Yes . . . but highly unlikely.
The 75P to 95P = 17 to 26 months. This seem to be a commensurate baseline range for RGDP cycle recovery time based on this black swan event (i.e. atypical structural economic damage) that has already begun
Full RGDP Recovery defined by returning to 2019Q4 aggregate RGDP levels of $19.222 trillion.
Thus, if the aggregate RGDP trough hits fast and quick during 2Q2020 (theoritically possible, yet more likey during 3Q or 4Q of 2020 and quite possibly beyond) . . . then the economy will not see RGDP recovery until 20214Q to 20224Q.

Fractional Analytics
For medium to large businesses, data and analytics is critical to sustaining competitive advantage. However, with 80% of IT and analytics projects either failing or having little to no impact, now is the time to re-evaluate the inputs of your internal IT/BI/Analytics functions . . . and Competitive Analytics can help develop a detailed analytics-driven plan for the following strategies:
Turn-Key Analytics (Analytics as a Service)
Software Review and Optimization
Hardware Review and Optimization
Replace in-house IT functions, analysts, data scientists.
Recession Planning
Unfortunately, time is of the essence in determining the who, what, when, where, why of cost and expense reduction. And these decisions should be made with a caring, logical, and data driven approach. Competitive Analytics can help develop a detailed analytics-driven plan for the following strategies:
Operating Cost Reduction
Capital Cost Reduction
Technology Cost Reduction
Human Resource Evaluation
Increasing Operational Efficiency
Increasing Convenience and Value to Existing Customers