Cities
“For those who are lost, there will always be cities that feel like home.” – Simon Van Booy
Advanced Analytics for Cities
As cities across the globe compete for residents, employees, employers, visitors, infrastructure, funding, and a myriad of other valuable resources, forward thinking city decision makers now need advanced analytics more than ever . . . to make better and faster decisions in order to realize sustainable growth for their cities. To that end, Competitive Analytics empowers city executives with a comprehensive array of options within the big data and advanced analytics realm . . . from interactive dashboards, predictive analytics, and economic impact modeling . . . to quality of life indices, budget optimization tools, and land use optimization tools . . . and everything and anything in between. Cities sit on a treasure trove of data they are just not using, and so, Competitive Analytics can help cities decipher, diagnose, trend, and forecast every vital city performance indicator imaginable.
Think “Moneyball for Cities.” Whether you are a city manager, mayor, council member, city planner, policeman, or fireman . . . being able to access interactive “city intelligence” encompassing every dimension of your city’s data in seconds (anywhere and anytime) is now no longer a luxury, but a necessity. For city officials who want (and need) to make better, faster, more productive, and more informed decisions . . . leveraging big data and advanced analytics is paramount.
Here’s just the proverbial tip of the iceberg in terms of the type of analytics cities should be leveraging:
Air Quality Analytics
Budget and Spending Analytics
Capital Market Analytics
City Council Dynamic Dashboarding
City Planning Analytics
City Services Analytics
Commercial Real Estate Analytics (Demand, Supply, Pricing)
Communication Analytics
Community Design Analytics
Community Re-Investment Analytics
Competitive Cohort City Ranking and Analytics
Demographics
Economic and Fiscal Impact Analytics
Economic Development Analytics
Education Analytics (Student Performance)
Employment Analytics
Energy Usage and Conservation Analytics
Environmental Resource Analytics
Geo-Spacial Analytics
Governance Reporting & Analytics
Infrastructure Analytics
Land Use Analytics (Feasibility and Optimization)
Parks, Recreation, and Open Space Analytics
Predictive Analytics and Future Proofing
Psychometrics
Public Health Analytics
Residential Real Estate Analytics (Demand, Supply, Pricing)
Safety & Crime Analytics
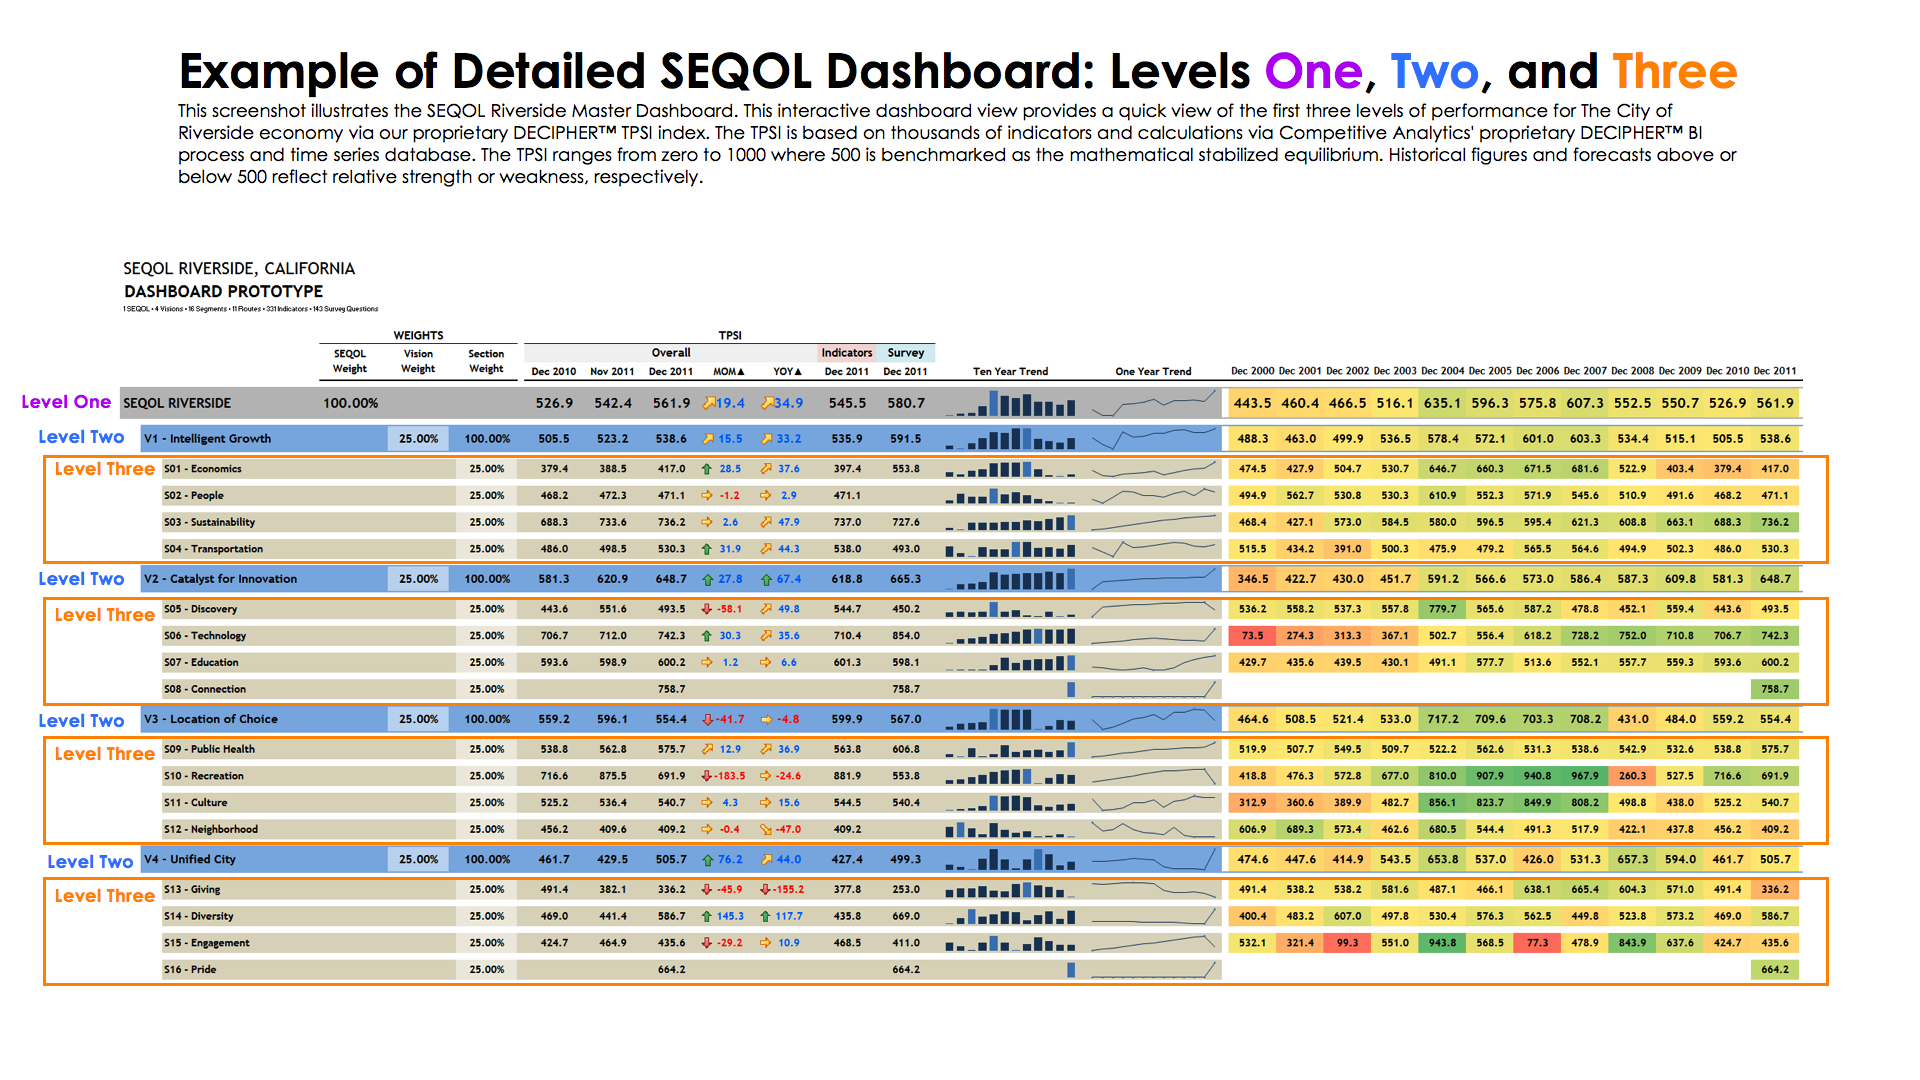
SEQOL: Significantly Enhanced Quality of Life
Social Media Analytics
Sustainability Analytics
Technology Impact Analytics
Transportation & Mobility Analytics
DECIPHER™ SEQOL Planning Tool
An Unparalleled Measurement, Planning, and Monitoring Tool for Cities, Counties, and States
Competitive Analytics designed and developed an unparalleled quality of life index and planning tool called DECIPHER SEQOL (acronym for Significantly Enhancing Quality Of Life). This dynamic and multi-functional index is unlike any other in terms of accuracy and usefulness. It is both an index and planning tool. Other quality of life indices are typically based on a handful of static indicators at a specific point in time. Furthermore, there is typically very little visibility into methodology. In contrast, the SEQOL Index is an extremely precise and accurate measurement tool measuring thousands of drivers of quality of life falling within categories such as education, economy, crime, environment, innovation, etc. This allows government officials and decision-makers to drill down three levels – Level 1: A singular top-level score for the city, county or state; Level 2: Categorical rankings (e.g. Education, Crime and Safety, Economy, Environment, Innovation, Economic Development, Affordability, Technology, Demographics, and other categories); and Level 3: Each individual indicator that underlies the categorical and top-level score (e.g. SAT scores, misdemeanors, air quality metrics, etc). Moreover, government officials can use SEQOL as a strategic planning tool in that each department can drill down into the drivers that affect their area of responsibility for measurable performance benchmarking. Furthermore, SEQOL is a monitoring tool in that it tracks indicators over a period of time, allowing government officials to monitor the impact of their decisions over time. Finally, the SEQOL Index is interactive in that city officials are able to change certain aspects, components, and weights of the scoring methodology (e.g. the weighting of specific drivers). For example, with respect to city planning, DECIPHER™ SEQOL analyzes all specific categories of land use development along with economic and demographic indicators that correlate with these land use categories. These correlative indicators are then used to forecast demand/supply for residential housing (for-sale and apartment), retail, office, industrial, hotels, schools, transportation, etc. empowering local governments to make optimized decisions with respect to future land-use (based on forecast scenario models of residents, employees, employers, visitors, etc.).